Splunk – Business Insights in Real Time
Every business and organisation generates massive amounts of data as a by-product of its operations. Imagine if you could leverage all of this information in an automated and intelligent way to help guide your business.
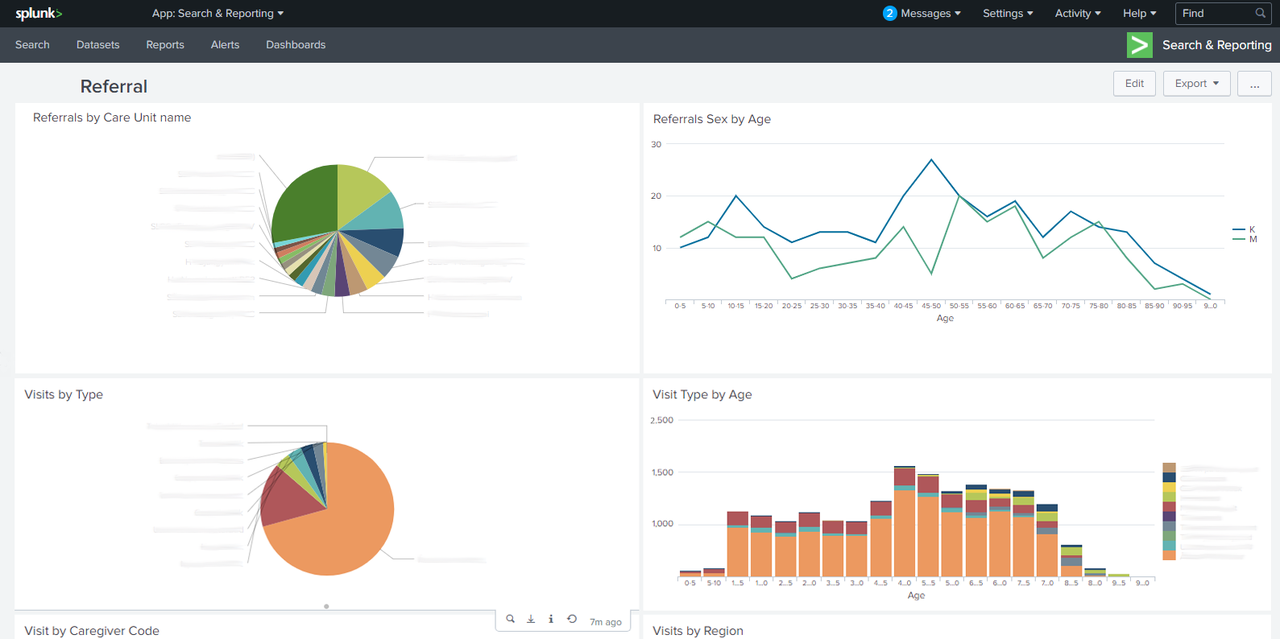
Splunk Dashboard - Statistics compiled from various data sources.
Machine Data
A part of all the data generated within your organisation comes from the tools and systems you use. These data are called “machine data” and are generated by the websites, programs, servers, network devices, mobile devices, apps and more that power your business. Machine data is one of the fastest-growing and most complex aspects of “big data”, but also the most undervalued and underused asset among organisations.
Real-time Business Insights
Traditionally, machine data has been referred to as “log data”; i.e. events that take place are logged and this log is then analysed in order to identify errors, patterns, etc. that indicate changes. This is both a difficult and time-consuming task, however.
Enter Splunk. Splunk transforms decentralised and often difficult-to-interpret machine data into clear and organised business insights in real time.
Real-time Analysis
Splunk’s real-time data analysis gives you a running overview of and insight into exactly what is happening in your business, letting you react immediately whenever you detect changes.
Obviously, this is a huge advantage. Instead of waiting until a problem arises and, in the worst-case scenario, causes damage, real-time business analysis lets you:
- make immediate adjustments
- see the effects of the adjustments without delay and
- make sure that they achieved the desired outcome and that your system is back on track and delivering as expected.
Splunk
You can use Splunk to collect, index, monitor and analyse all forms of machine data generated by both your organisation’s and your customers’ activity. Splunk lets you measure everything from your customers’ interaction with services, application performance and user behaviour to the internal use of systems, security monitoring and IoT-sensor monitoring.
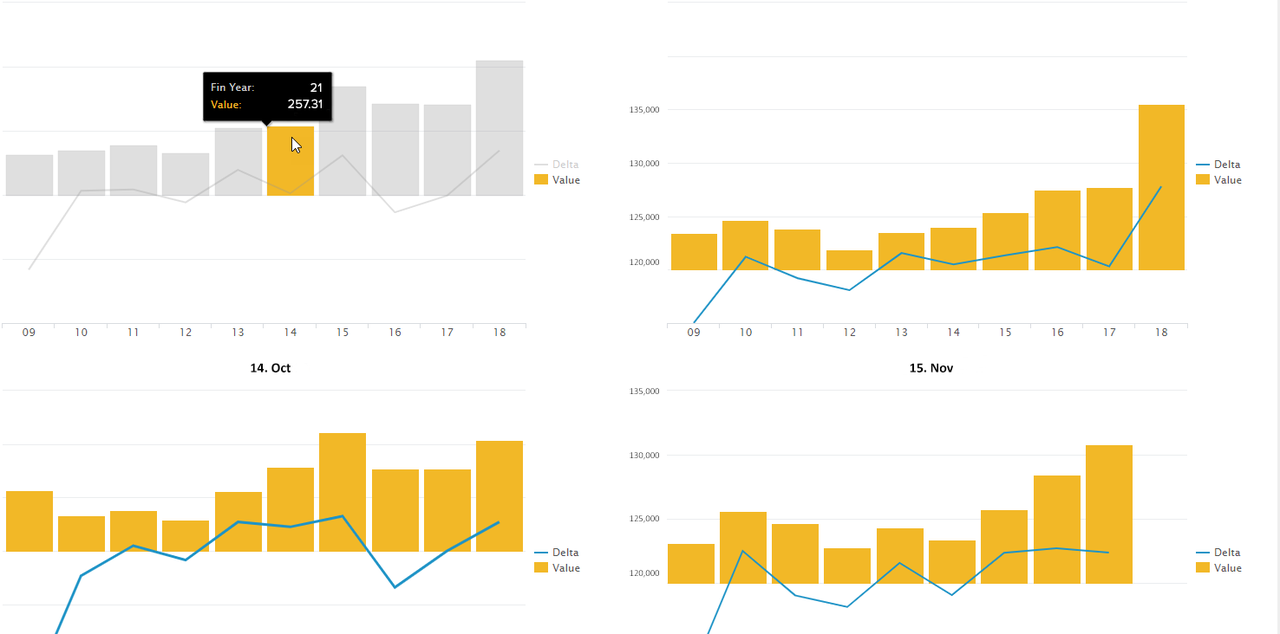
One way of visualising sales statistics in Splunk.
Dashboard
Another advantage to Splunk is the ability to create customised dashboards, or information panels. Employees with different roles also have different needs when it comes to information. Splunk offers each employee the option to build their own customised analytics dashboard. Information can be displayed as diagrams, reports, alarms, notifications, animated graphics or other visualisations, making the results clear and easy to understand.
The information is also universally available and is identical no matter who accesses it. There are no different versions of reports nor delays in the flow of information.
Splunk dashboards can also be projected onto large screens or viewed on computer monitors or mobile phones. Naturally, Splunk also allows you to restrict access to your data, which is especially important when it comes to business-critical data and patient data collected by healthcare providers, for example.
Operational Intelligence
The information generated by Splunk:
- deepens customer insight
- reduces operating costs
- improves quality of service and
- reduces the risk of unauthorised data access and fraud.
Splunk collectively defines these advantages as “operational intelligence”, which loosely corresponds to the corporate world’s “business intelligence”.
Put simply, Splunk gives data architects, analysts, marketeers and product managers access to new, analysed data sources that, when combined with structured data, provide valuable business insights in real time.
Want to know more about Splunk and how to leverage your own machine data? Contact us today.
